
Workplace Dynamics
People, Industries & Jobs
What is This?
Workforce Dynamics is a data visualization tool created to inform the work of the WDC and our partners to advance racial equity. The depth and magnitude of disparities can be challenging to quantify. Data from sources such as the US Census offer standard quantitative measures such as household and per capita income indicators of equity. Visualization serves to reveal trends in the data, and identify areas where further examination is needed.

Data Indicators: Income + Impact & Experience of Poverty + Wealth & Asset Building

Data Indicators: Median Income + Per Capita Income
Future Updates
Labor Force Participation
Commuting & Migration
Workforce Demographics
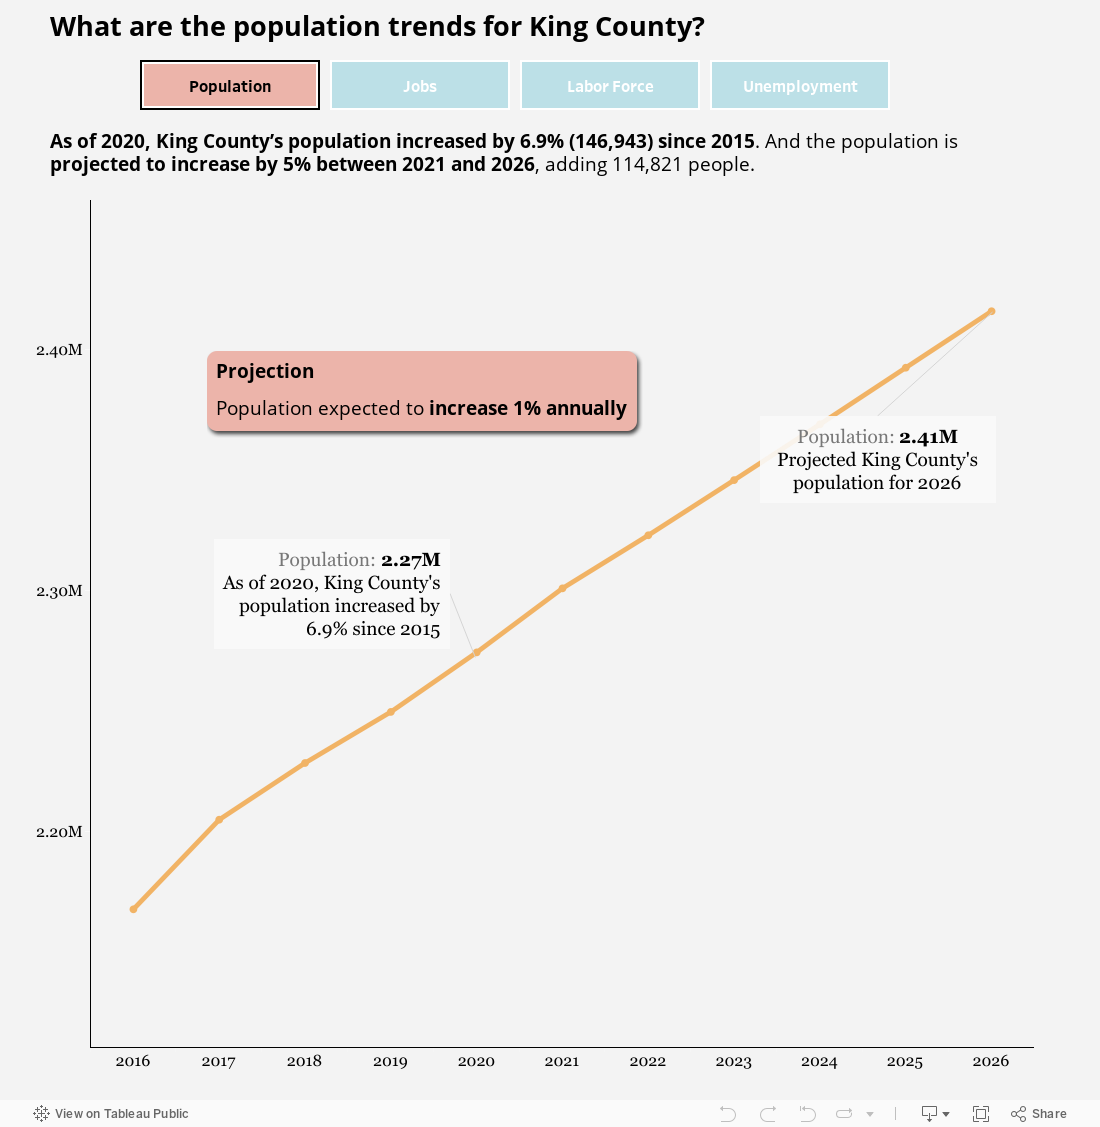
Population Change
Labor Market Information
A New Approach
Data about racial inequity must be viewed within the historical context of race and racism in the United States. Without this history, the data can be misinterpreted or misused to promote racist ideologies. In fact, the data reveals the consequences of a long history of racial oppression.
-
The 2021 report, Advancing Workforce Equity in Seattle: A Blueprint for Action, subverts the narrative that Seattle, and King County at large, is "a robust regional economy shaped by technological advancement, global connectivity, and demographic change." Instead, the report emphasizes:
“Such topline measures mask racial gaps in employment and wages, and obscure entirely the intergenerational inequities that disadvantage communities of color. People of color continue to face significant barriers to accessing good jobs and opportunity, including discriminatory hiring practices, gaps in educational attainment, low job-quality standards, and housing and transportation inequities that create a vastly uneven geography of opportunity.” (Pg 13)
In this moment of economic crisis and recovery, we want to “rebuild better," not return to the status quo. These data visualizations are intended to support strategies that center equity as the superior growth model toward building a thriving and inclusive economy that benefits all workers, residents, and communities. This work will require bold, collaborative and integrated solutions across multiple systems.
-
Workforce Dynamics is a baseline mapping of the people, economy, and industry in King County. And it stands on the shoulders of decades of research into the history of systemic racism.
Examples include:
Multimedia Feature: Segregated Seattle – The Seattle Civil Rights & Labor History Project by University of Washington
Feature and Video: What Seattle’s redlining history tells us about wealth today by Crosscut
Feature Article: Redlining in Seattle by History Link
Recording of Panel Discussion: Seattle on the Line: Examining the History & Contemporary Impact of Redlining by Northwest African American Museum
-
The primary data sources for this project are the United States Census 2020 and Lightcast (formerly Emsi Burning Glass).
United States Census
The United States Census 2020 is useful for graphing population change, mapping various communities, and measuring income disparities
The American Community Survey, as part of the census, provides data by zip code for metrics such as household income and per capita income.
Lightcast tracks a variety of economic indicators spanning industries, occupations, workforce, job postings, and labor market data from multiple sources, such as Bureau of Labor Statistics
Methodology
Workforce Dynamics employs mix-method analysis to bridge economic and social data, designed to provide specific analysis and avoid over-generalization.
-
A primary goal of this project is to utilize data to inform our work to advance racial equity in King County. Thus, race is central to our analysis of the data and to how we will define and measure our progress.
-
Aggregation of data hides the inequities between populations by grouping disparate communities and people together. In order to understand the conditions in a particular community or population, we need to divide data into separate and distinct groups.
For instance, the median, annual household income for King County is $95,000. Aggregated data summarizes a range of incomes from the highest to the lowest among all income earners. When the data is disaggregated by race and zip code it reveals racial disparities between BIPOC and White households. Even racial categories, such as Asian, still mask inequity among varied populations, such as Vietnamese and Chinese. In the future, this project aims to further disaggregate sub populations within racial categories.
-
The median is the midpoint in a data set, separating an equal number of higher and lower data points. The mean represents an average calculated by dividing the sum of all values by the total number of values.
The median is preferred in this analysis as it offers a more consistent value for comparison across multiple data sets and is less prone to distortion by outliers. These distortions can mask drastic racial inequities.
-
This is a living resource that will be updated over time with additional dashboards and new data as it becomes available. To receive updates on the next phases of the project, sign up for our newsletter.
Historic & Projected Trends
On the Surface
According to most mainstream indicators, King County has recovered from the acute economic recession of February to May 2020 that resulted from the initial onset of the COVID-19 pandemic. Job growth and labor force participation are steadily recovering and the unemployment rate has returned to pre-pandemic levels.
The Dynamics Underneath
The structure of the regional economy and labor market (pre- and post-pandemic) produces racial gaps in employment and wages, with stark occupational segregation in access to quality jobs. Disparities in opportunities for educational attainment, affordable housing, and transportation access are the result of systemic and structural barriers that have been constructed over time to benefit White people at the expense of Black, Indigenous, and People of Color.