
5 Tips for Using the New Talent Pipeline Application #seakingwdcapp
The word is out! Our new Talent Pipeline Application is launched and ready for your everyday use.
- Sign-up for one of our upcoming virtual "Resource Showcase" events to learn tips and tricks via Eventbrite
Our partners at Community Attributes, Inc. and our staff Performance Manager, Bryan Pannell, have put together a few tips for using this new resource.
Tip #1: Get acquainted

Our new web-based, Talent Pipeline Application brings together occupation and industry data and forecasts to build projections of supply and demand at the occupation level. This is extremely valuable information for King County employers, job seekers, education and training providers and employment specialists! The data provided can inform decisions on the activities of all of these audiences. Employers and the workforce development system can strategize on how to address potential issues. Job seekers and employment specialists can make educated decisions on career options. Education and training providers can use the data in the design of program and training curricula.
Try it out!
- Use the "Occupation" filter on "Computer & Mathematical" and the app shows high demand for computer science bachelor’s degrees
Tip #2: Check out all the industries

Over the past 7 years, the Workforce Development Council of Seattle-King County has issued industry-specific “paper” Talent Pipeline Reports. This new application is not limited to a specific industry but covers all King County sectors! Users can filter results on a range of data elements including Industries, occupations, median wages, education requirements and economy or cluster level analysis. Applying these filters dynamically delivers workforce supply and demand data broken done by education/training requirements and delivers information on the availability of area education and training programs.
Try it out!
- Use the "Education" filter to associates degree, and see what industries and occupations have shortages to find a job based on your education level
Tip #3: The dashboard is your friend
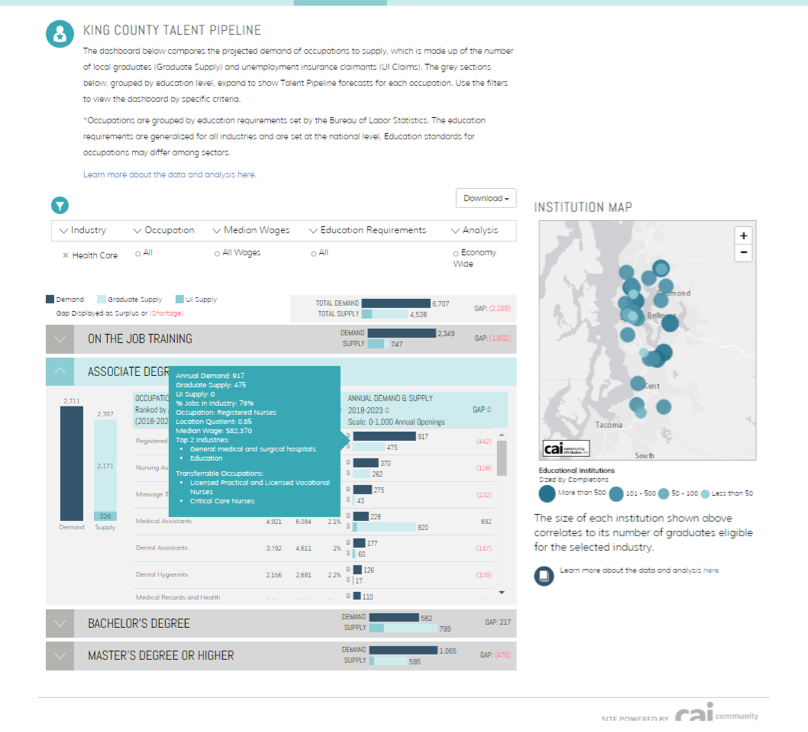
The core of our new web-based Talent Pipeline application is the Dashboard. The Dashboard delivers a wealth of information! By applying the filters on the page, users can build a customized picture of occupations in a specific industry or group of industries; or get a bird’s eye view of an occupation across industries. Results are broken down by education/training level required with shortage/surplus workforce highlighted by occupation. Mouse-overs bring even more data to light for each occupation. The Institution Map also responds to user filters and displays education/training providers in the area that correspond to the occupations for the results. Institution data also includes number of average annual program completions.
Try it out!
- The "Institution Map" can be used to tap into what programs are out there...
- Examples: Check out the concentration of registered nurses from select institutions or computer science graduates from Seattle University
- Use the "Industry" filter on...
- Healthcare = the app shows demand for masters and higher education or on the job training
- Education = the app shows huge supply of postsecondary teachers
- Information Technology = you'll be able to expand the bachelors degree section, mouse over software developers, and look at a detailed info window--showing you can make over $100k with a bachelors degree
Tip #4: Get into the matrix

Want to see how a certain occupation can be part of multiple industries? Our new web-based Talent Pipeline application can do that! By applying filters for industry, occupation, median wages, education/training requirements and/or level of analysis, users can construct a customized Occupation Matrix that gives an overall view of how an occupation is a part of a variety of industries. Dynamic mouse-overs deliver even more specific data for a specific sector. This type of data can be used by job seekers and employment specialists to explore opportunities across industries.
Try it out!
- Put the "Wage" filter over $100k to see industries and occupations that make the most money
- You can also change the view to surplus and shortage to see where the openings are, and where there might be more competition (for example in manager occupations)!
- The "Percent in industry" shows how flexible an occupation is
- You'll find that office and administrative support is needed in every industry...
- Try the "Median Wage" filter, and filter salaries at 100k or less, finding out educational requirements
Tip #5: Method to the genius

Want to know the recipe for putting together all of the great data in our new Talent Pipeline web-based app? No problem! The Methods tab gives users access to the methodology and sources that were used to develop this great new tool. Taking the tried and tested work of our previous “paper” reports and transferring them to an interactive, user-friendly application has been an amazing process! And users can see where the data comes from and why each piece is critical to the overall picture.
...& Make it your own!
There's no limit to how useful this tool can be. Career counselors and coaches, educators, employers, job seekers, students and prospective students, workforce organizations, reporters and researchers--it has something for everyone. Compare notes with your colleagues and let us know how you're using it, so we can pass on the good word. Tweet #seakingwdcapp or send a note to Hannah at hmello@seakingwdc.org.
Questions?
Reach out to Hannah Mello, our Communications Manager: hmello@seakingwdc.org - 206.448.0474 ext. 3014